


EVE LiFePO4 State of Charge Chart & Discharge Curve & Capacity Diagrams
2025.05.27


A capacity diagram helps assess a battery's performance, condition, and life. It reveals how much charge a battery can hold and deliver over time, which is vital for electric vehicles and renewable energy systems. E.g., the LiFePO4 state of charge chart illustrates the relationship between voltage and remaining capacity. It helps users determine the battery's current state and predict its behavior under loads. Thanks to this chart, engineers can identify signs of decreased capacity or increased internal resistance, which may indicate aging or damage. It is key to implementing upkeep strategies and confirming that the battery operates within safe and efficient parameters.
EVE Prismatic Battery's Capacity Diagram, SOC, and Discharge Curve
State of Charge Chart of LiFePO4 Battery
Percentage (SOC) | 1 Cell |
100% Charging | 3.65 |
100% Rest | 3.40 |
90% | 3.35 |
80% | 3.32 |
70% | 3.30 |
60% | 3.27 |
50% | 3.26 |
40% | 3.25 |
30% | 3.22 |
20% | 3.20 |
10% | 3.00 |
0% | 2.50 |
This LiFePO4 state of charge chart (SOC) converts the open‑circuit voltage into a percentage figure that feels as intuitive as the fuel gauge on a car. Reading it is simple: while measuring resting voltage, read across to see the SOC for a single cell. A fresh charge settles 3.40V per cell (≈ 100%SOC), 3.32V signals 80%, and the scale continues down to 2.50V, where a usable charge is effectively zero. Because the charging voltage (3.65V) is higher than the resting voltage, let the pack rest for a few minutes before taking a reading. Doing so avoids over‑estimating SOC. This chart is a handy field tool: by matching pack voltage to the green, orange, or red bands, you know—without a coulomb counter—how much runtime is left and whether the cells are entering a depth of discharge that could cut cycle life.
Capacity Diagram & Discharge Curve

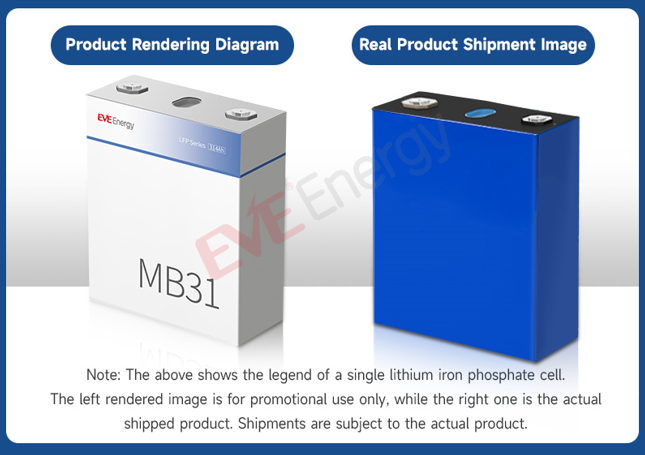
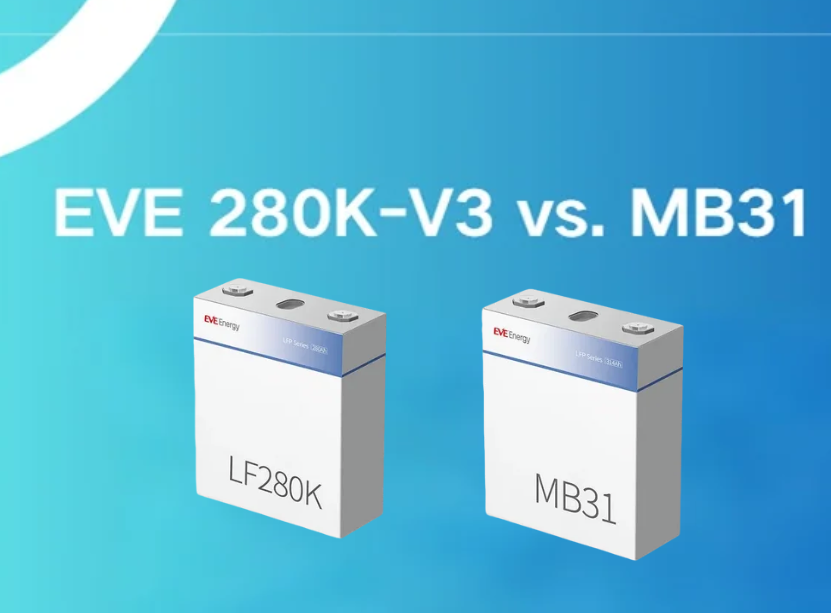
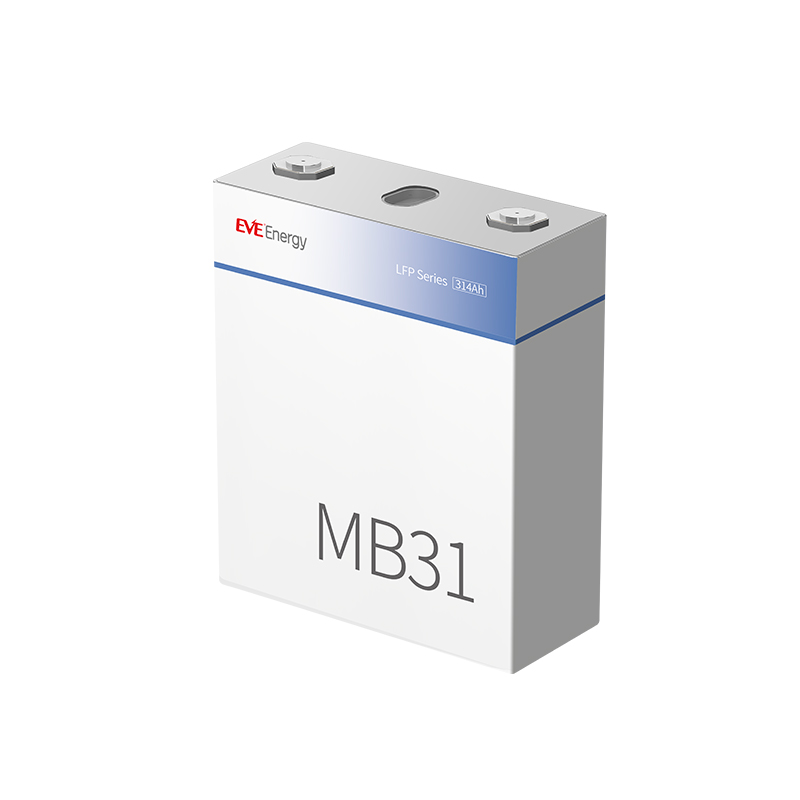
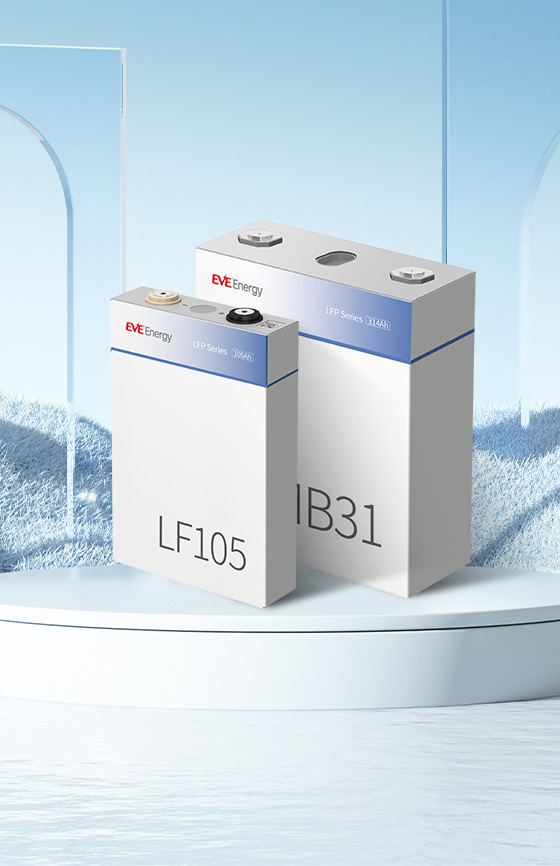
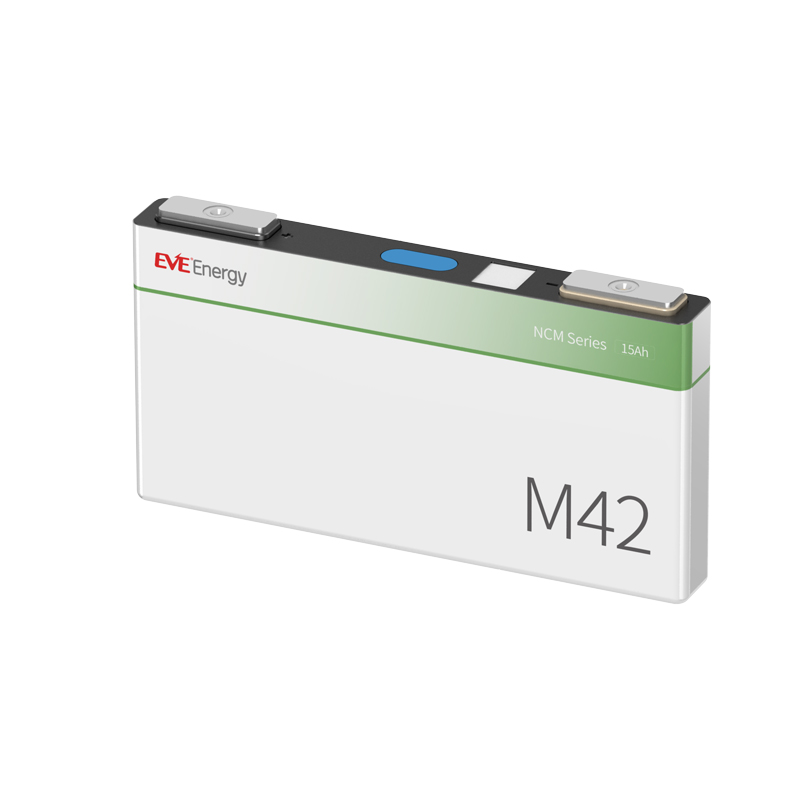
We rate the MB31 prismatic LFP cell at 314Ah nominal capacity and 3.2V nominal voltage. The LiFePO4 battery capacity chart plots the cell's terminal voltage on the vertical axis against the amp‑hours on the horizontal axis. A flat segment of 3.30-3.25V represents the healthy "plateau" where most of the energy is available. The gentle downward slope reveals internal resistance losses. Once the trace drops sharply—below 3.0V—you have hit the knee of the curve, meaning less than ~5 % capacity remains, and the pack should stop discharging.
To read, choose any point on the x‑axis, move up until you meet the curve, then read left to see the corresponding voltage. This tells you how far you've traveled through the 314Ah reserve and whether it is time to recharge. Because the curve is generated at a defined current, comparing several runs at different C‑rates lets you see how heavier loads shorten the flat section and accelerate the knee.
A LiFePO4 battery discharge curve tracks cell voltage as a function of time or delivered capacity while the cell is under load. It shows how higher C‑rates or colder temperatures pull the curve downward, shortening apparent capacity and moving the knee leftward. When we validate MB31 cells, we overlay 0.1 C, 0.2 C, 0.5 C, 1 C to check that voltage sag stays within spec and that capacity retention at high load meets our datasheet.
To use the curve, note the test C‑rate and follow the chosen line until it intersects the 3.0V cut‑off. The point tells you the amp‑hours you will obtain at that load. Comparing multiple curves shows why moderate currents boost runtime and why packs in cold climates need extra headroom. Taken together with the capacity diagram and SOC chart, the discharge curve completes the picture. It links real‑world load profiles to the voltage‑and‑capacity story so you can size, protect, and monitor our prismatic cells.
Advantages of the EVE LFP Battery Hidden In Diagrams and Charts
The curves underline why our MB31 cell stands out: the flat voltage plateau shown in the capacity and discharge traces keeps power delivery steady almost until the last amp‑hour, so equipment sees a rock‑solid 3.2V instead of the roller‑coaster common with other chemistries. Add the low 0.18 mΩ internal resistance, and the knee in the discharge curve slides far to the right, meaning less wasted heat and more of the rated 314Ah usable under load.

The LiFePO4 state of charge chart then turns that flat plateau into an easy fuel gauge—small changes in resting voltage translate into real‑world runtime, simplifying pack monitoring. Finally, the specs behind the graphs—8000 cycle life (25°C) and operation(discharge) from ‑30°C to 60°C—reveal that the gentle slope you see today will still look familiar years later and in harsh weather. The diagrams tell a simple story: long life, high usable capacity, consistent voltage, and low loss every time we discharge.
Tips for Retaining a Healthy Discharge Rate
ü Keep the state of charge between roughly 20% and 80%.
ü Limit sustained high‑current discharges; size the pack for expected load.
ü Avoid letting cell voltage fall below 2.5V per cell.
ü Store the battery at 0°C~25°C, relative humidity≤60% whenever possible.
ü Balance cells regularly with a quality BMS.
ü Use gentle discharge rates during the first few cycles ("break‑in").
ü Minimize deep discharges during cold weather.
ü Calibrate pack SOC readings every few months with a full charge-discharge cycle.
ü Disconnect parasitic loads when the pack is idle for protracted periods.
ü Monitor internal resistance and retire cells that drift significantly.
Conclusion
For accurate monitoring, we provide a LiFePO4 state of charge chart to help in battery management. At EVE Energy, we engineer precise battery solutions. Our prismatic LFP cells, including the MB31, deliver 8,000 cycles at 70% depth of discharge and guarantee durability. Our collaborations span industry leaders, such as GoodWe, HUANENG, and AlphaESS, which shows that we have given our word to quality and innovation.